Your irrigation system is down because of a surprise irrigation tire failure1, flooding one area and starving another. You're losing time and money fixing a problem you never saw coming.
Because tracking trends reveals risks far earlier than single inspections. A simple system that grades tire health helps you move from reactive repairs to proactive management2, saving money and increasing reliability.
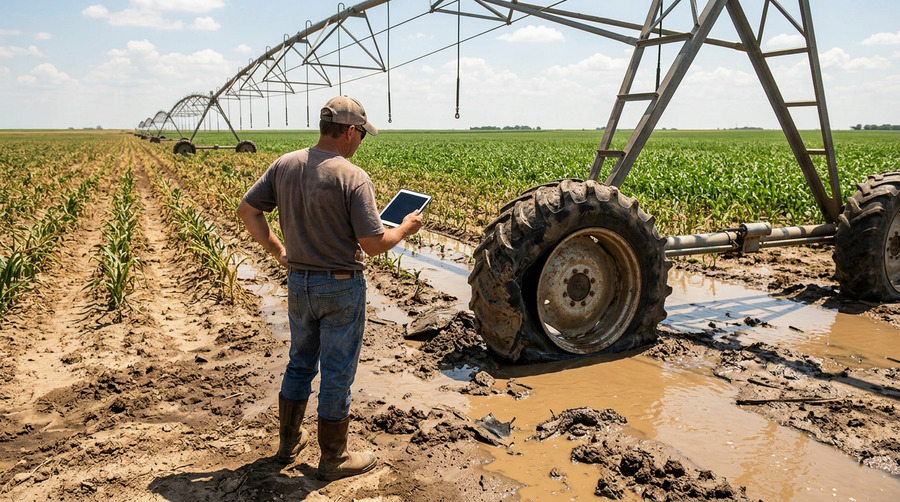
I remember talking to a large farm co-op manager who was frustrated with his pivot tire costs3. "They just fail whenever they feel like it," he said. He viewed irrigation tire failures as random, unavoidable events. I asked him if he was tracking their condition. He laughed and said he didn't have time for that. A few months later, a single tower's tire failure caused a cascade that took down three other tires and damaged the drivetrain. The cost was astronomical. The irony is, a five-minute check per week could have flagged the initial problem and prevented the entire disaster.
Is Complicated Software Needed for Effective Tracking?
You hear "tracking system4" and imagine expensive software and hours of data entry. The thought of adding another complicated task to your day makes you want to give up before you start.
No, a simple log5 is all you need. Effective tracking relies on consistent data, not complex tools. A basic spreadsheet or even a dedicated notebook is powerful enough to provide maximum control with minimal effort.
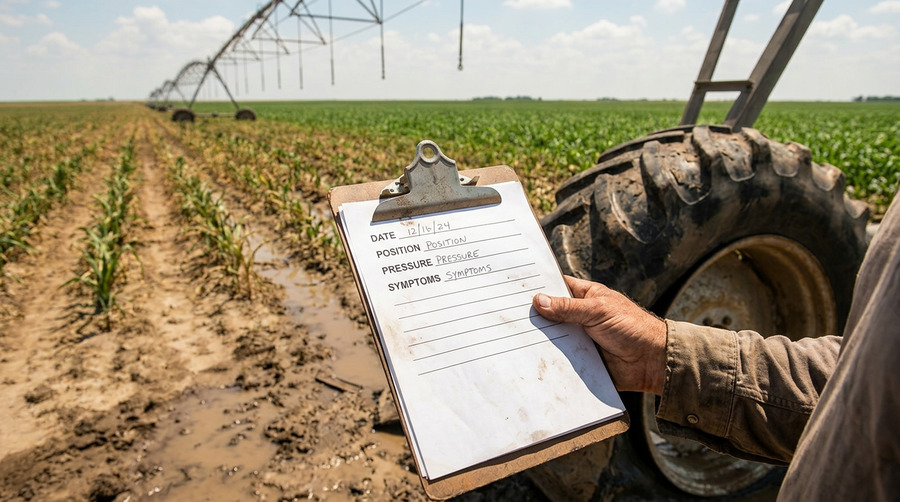
The goal is to spot patterns, and for that, you only need a few key pieces of information collected consistently. Forget fancy dashboards and complex analytics. The most successful tracking system4s I've seen are built on a foundation of four simple data points. The discipline is in collecting them regularly, not in the technology used to store them. You can start this afternoon with a pen and paper.
The Four Essential Data Points6
| Data Point | Why It's Critical | Example |
|---|---|---|
| Date | Establishes a timeline to measure the rate of change. | 10/15/2023 |
| Tire Position | Pinpoints which tire is having issues (e.g., Tower 3, Outer). | T3-Outer |
| Visible Symptoms | Notes physical damage like cuts, weather cracking, or bulges. | Deep cracks near bead |
| Tire Pressure (PSI) | The single most important indicator of a tire's health and potential leaks. | 18 PSI |
Just by tracking these four things, you create a history for every tire. This history is what turns random data into actionable intelligence.
How Do Trends Reveal More Than a Single Inspection?
Your technician does a walk-around and reports that all tires look "okay." But how can you be sure a problem isn't developing just below the surface?
Because single inspections only show a snapshot in time. Tracking the data reveals patterns—like slow pressure loss7 or accelerating wear—that expose hidden risks before they become visible failures. Trends matter more than isolated incidents.
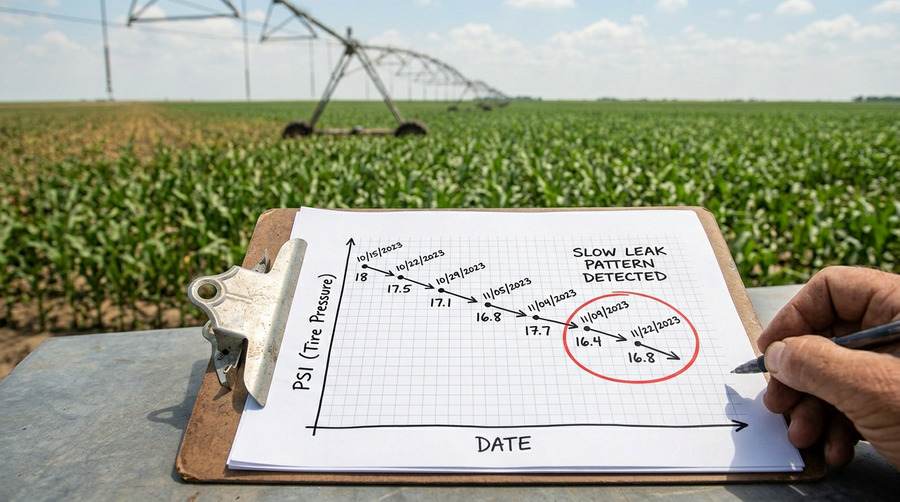
Think of it like monitoring your own health. A single blood pressure reading might be normal. But if you tracked it every week and saw it was slowly creeping up, you'd know there was an underlying issue to address. It's the same with your irrigation tires. A tire that is at 18 PSI today when it was 20 PSI last week might seem fine. But if it was 22 PSI the week before that, you don't have a "fine" tire; you have a tire with a slow leak that is guaranteed to fail. The single snapshot looks okay, but the trend reveals the truth. This is proactive maintenance. You're not waiting for the tire to be flat; you're spotting the leak and scheduling a repair during a planned downtime, not in the middle of a critical irrigation cycle.
How Can Color Coding Simplify Field Decisions?
Your technician finds a tire with some sidewall cracking. Is it an emergency? Can it wait a month? The ambiguity leads to indecision or, worse, a bad call.
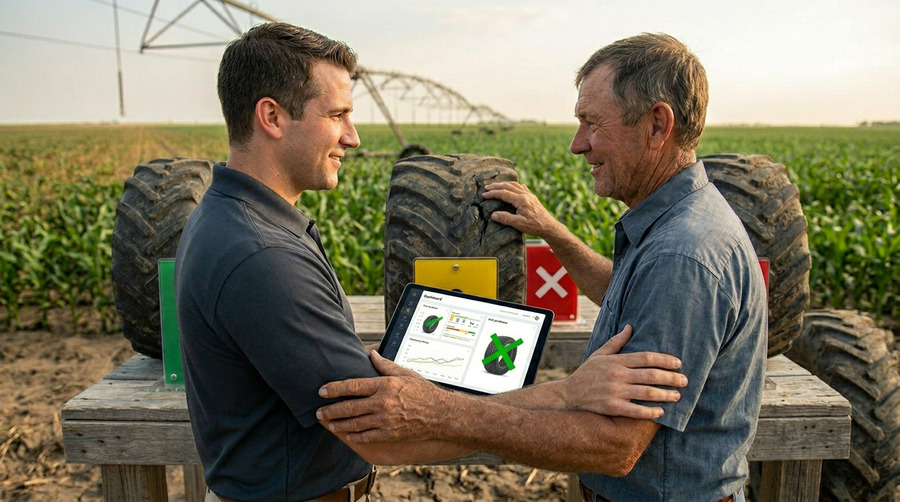
A simple Green/Yellow/Red risk grading system8 removes the guesswork. It creates a clear, shared language for everyone, allowing technicians and managers to instantly align on whether to monitor, schedule maintenance, or replace a tire immediately.
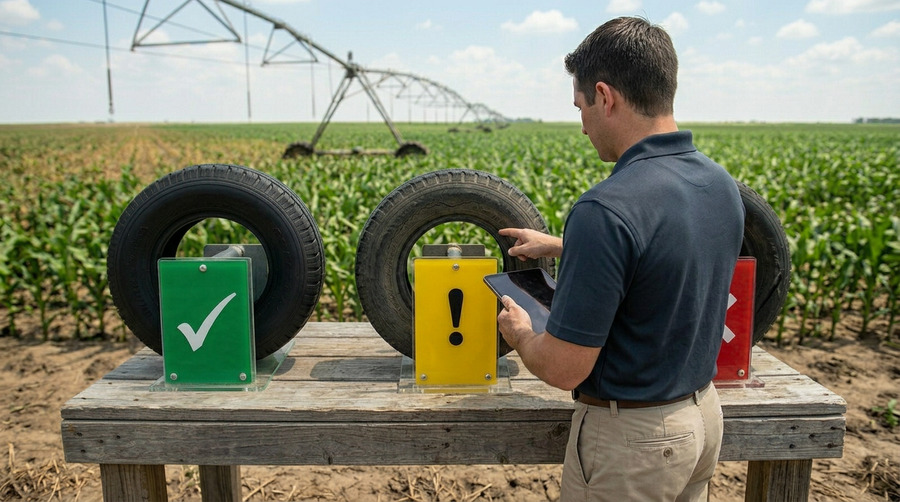
Ambiguity is the enemy of efficient operations. A simple color-coded system forces a clear decision based on pre-defined rules. It's a powerful tool that transforms a technician's subjective observation ("it looks a little worn") into an objective action plan.
A Simple Risk Grading Framework9
| Risk Level | Criteria | Action |
|---|---|---|
| Green | Correct pressure, no visible damage. | Monitor: Continue routine checks. No action needed. |
| Yellow | Minor pressure loss (<10% a week), superficial weather cracking. | Schedule: Plan for inspection or repair during next downtime. |
| Red | Significant pressure loss (>10% a week), deep cuts, bulges. | Replace Immediately: High risk of imminent failure. Act now. |
When your technician can simply mark a tire "Yellow," the manager knows exactly what that means without a lengthy phone call. It means "this is not an emergency, but put it on the schedule." This system streamlines communication, empowers your team, and prevents critical issues from falling through the cracks.
How Does Tracking Irrigation Tires Make My Dealership Look More Professional?
As a tire dealer, you sell a quality product. But in a competitive market, how do you differentiate yourself and build unshakable trust with your clients?
Because a structured tracking system10m](https://arxiv.org/pdf/2304.01435)%%%FOOTNOTE_REF_4%%% demonstrates discipline and reliability. When you systematically track irrigation tire health for your clients, you shift from being a parts seller to a trusted partner, appearing more competent, transparent, and professional.
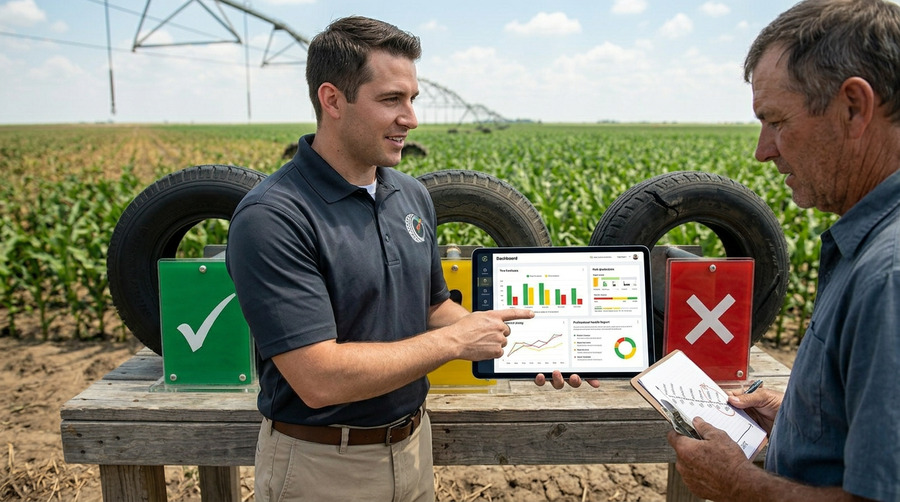
Imagine two dealers. One sells you a tire. The other sells you a tire and provides a simple log5book, explaining how to use it to prevent future failures11. Which one do you trust more? Which one seems more invested in your success? By offering tracking as part of your service, you are providing value far beyond the product itself. You are selling risk management12. This approach shows clients that you understand their operational challenges and have a proactive plan to help them. It builds loyalty that can't be broken by a competitor who is a few dollars cheaper. As a dealer, this is your chance to prove your expertise and become an indispensable part of your client's operation.
Conclusion
Tracking irrigation tire risk is not about complex data. It's about using simple, consistent checks to see trends, grade risks, and make proactive decisions that build trust and prevent costly failures.
Understanding the causes of surprise irrigation tire failures can help you prevent unexpected downtime and costly repairs. ↩
Learn how proactive management strategies can save you money and increase the reliability of your irrigation system. ↩
Discover effective ways to reduce pivot tire costs and improve the efficiency of your farm operations. ↩
Find out which tracking systems are most effective for monitoring irrigation tire health and preventing failures. ↩
Explore how maintaining a simple log can be a powerful tool in tracking and managing irrigation tire health. ↩
Learn about the four critical data points that can help you effectively track and manage tire health. ↩
Detecting slow pressure loss early can prevent tire failures and save you from costly repairs. ↩
Understand how a simple color-coded risk grading system can streamline tire maintenance decisions. ↩
A risk grading framework helps in making informed decisions about tire maintenance and replacement. ↩
A structured tracking system can enhance professionalism and build trust with clients. ↩
Tracking can help identify potential issues early, preventing future failures and saving costs. ↩
Explore the benefits of risk management to prevent failures and improve system reliability. ↩