You review engineering documents filled with complex calculations and safety factor1s, feeling confident that the wheels you're buying are built to last. Yet, unexpected field failures2 keep happening, making you wonder what the math is missing.
OTR wheel calculations3 typically assume simple, predictable, and static load conditions. They model a wheel under a clean, vertical load, but often ignore the messy, multi-directional, and dynamic forces4 that occur in real-world agricultural and industrial environments.
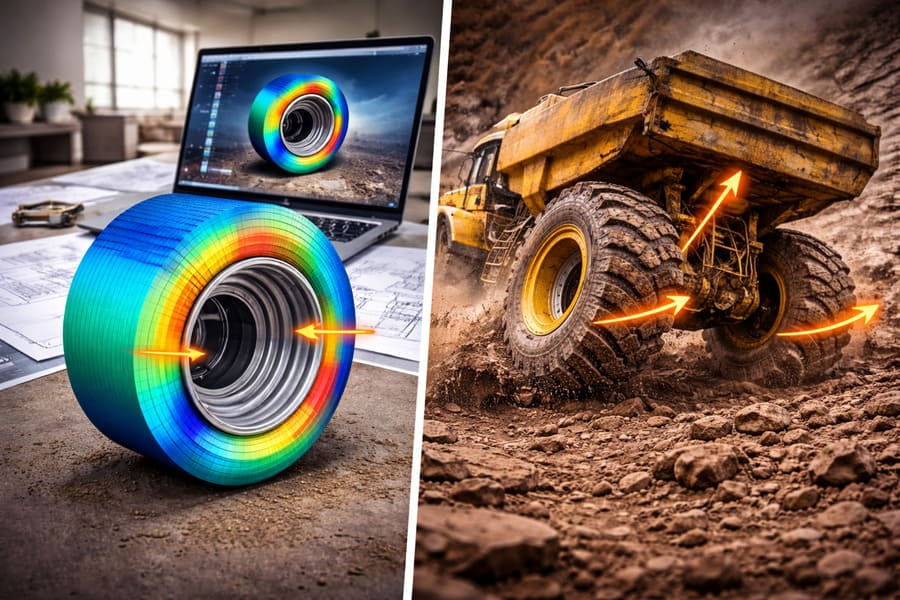
I'll never forget a visit to an engineering lab years ago. On one screen, I saw a beautiful Finite Element Analysis (FEA)5 model of a OTR wheel. The stress areas were neat, color-coded, and well within the safety limits. On the table next to the computer was the actual wheel from a field test—its disc was warped and there was a fatigue crack starting near the weld. The engineer told me, "The model passed every test we ran." I looked at the broken wheel and replied, "Then we aren't running the right tests." This is the fundamental gap in the OTR wheel industry: our calculations are often based on a perfect world, but our products have to survive in a chaotic one.
Are Calculations Based on a OTR Wheel Standing Still?
You see a load rating6 of, say, 10,000 kg on a spec sheet. You assume this means the wheel can handle that weight under any condition, but that's not always the case.
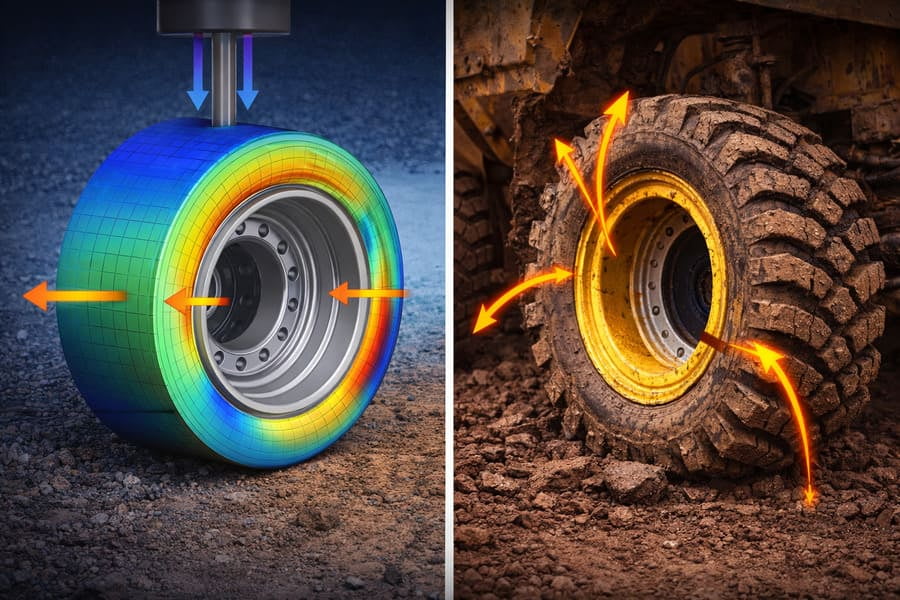
Often, that load rating6 is based on a quasi-static, single-axis calculation. It represents the force of gravity on a stationary or smoothly rolling wheel. It completely misses the multi-axial, dynamic forces4 from bouncing over ruts, turning on uneven ground, and sudden impacts.
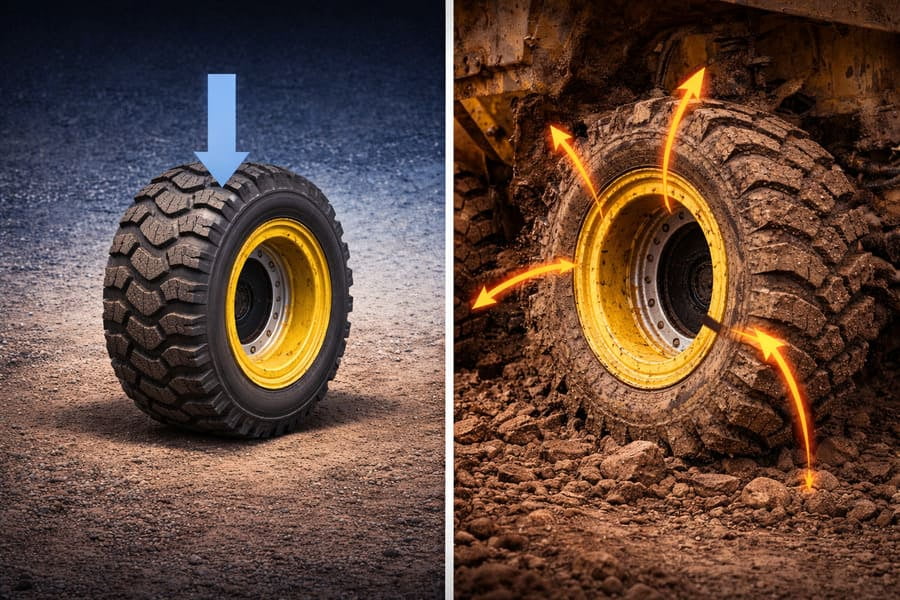
Think of it like this: calculating the stress on a OTR wheel that's just holding up a tractor is like measuring the strain on your legs while you're standing still. Now, imagine jumping, twisting, and landing on one foot. The forces on your legs are suddenly much higher and coming from different directions. This is what a wheel experiences every day. The initial calculation (the "standing still" part) is called a quasi-static load7. The real world is dynamic and multi-axial. Engineering models can be oversimplified, leading to a product that is technically correct according to the model, but practically inadequate for the field. The design is only as good as the reality it represents.
| Calculation Model | What it Assumes | Real-World Condition |
|---|---|---|
| Quasi-Static Load | Smooth, constant vertical force. | Bouncing, shocks, and impacts. |
| Single-Axis Force | Load pushes straight down. | Side-loads from turning and slopes. |
| Linear Behavior | Stress is directly proportional to load. | Twisting and flexing create non-linear hotspots. |
A calculation that only considers the wheel standing still is testing for a world that doesn't exist.
Why Does a OTR Wheel Fail When Turning, Not Driving Straight?
A OTR wheel performs perfectly for hundreds of hours while driving in a straight line, but a crack appears after a season of maneuvering in tight spaces. Why do combined movements cause so much damage?
Most real-world failures are caused by combined load cases8, like turning while braking or hitting a bump while carrying an offset load. Calculations often test these forces separately, but their combined effect is far greater than the sum of their parts.
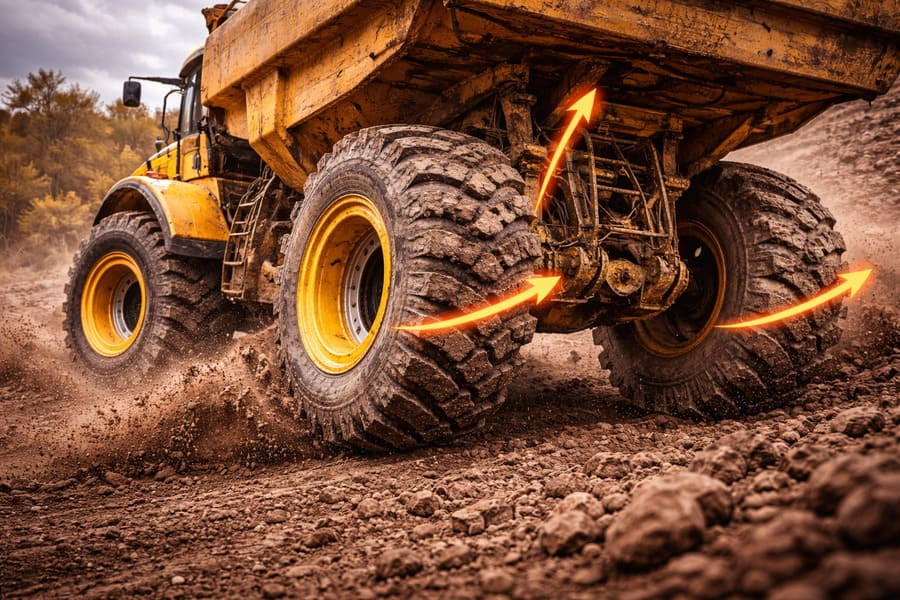
Imagine carrying a heavy box. It's manageable. Now, imagine carrying that same box while someone tries to push you sideways. Suddenly, it feels much heavier. This is what happens to a wheel. The vertical load from the machine's weight is the box. The side load from turning is the person pushing you. The braking force adds a twisting motion. Standard analysis might say the wheel can handle the weight, or the side load, or the braking torque. The critical mistake is failing to calculate what happens when all three occur at the exact same moment, which happens thousands of times in a wheel's life. This combination creates stress peaks9 in areas of the OTR wheel, like the bolt circle or the disc-to-rim weld, that were never anticipated by the simplified, one-stress-at-a-time models. It’s not one single force that breaks the wheel; it's the conspiracy of several forces acting together.
Do Fatigue Models Account for a Bumpy Ride?
Engineers perform fatigue analysis10 to predict how long a OTR wheel will last. So why are those predictions sometimes so wrong, leading to premature cracks and failures?
Classic fatigue models often assume regular, predictable stress cycles11, like a wave in a textbook. But real-world field loads are random and chaotic, with unpredictable spikes in amplitude and frequency. This randomness accelerates metal fatigue far faster than simple models predict.

Standard fatigue calculation is like bending a paperclip back and forth in the exact same spot with the exact same pressure until it breaks. You can reliably predict how many bends it will take. Now, imagine bending that paperclip randomly—sometimes a little, sometimes a lot, sometimes twisting it, sometimes doing it quickly, sometimes slowly. It will break much sooner, and in a less predictable way. This is the difference between a lab model and a field. A OTR wheel doesn't experience a smooth up-and-down stress cycle. It experiences a constant barrage of random impacts12: small jolts from gravel, medium shocks from furrows, and large spikes from potholes. These random, high-amplitude events do a disproportionate amount of damage, using up the wheel's fatigue life much faster than a clean, uniform calculation would ever suggest.
Is a "Safety Factor" Really Keeping the OTR Wheel Safe?
You're assured a OTR wheel is safe because it was designed with a "2x" or "3x" safety factor1. But if it's so safe, why does it still break when a customer uses it in a slightly different way?
A safety factor1 is designed to cover uncertainties in the calculation itself—things like material variations or manufacturing tolerances. It is not a magic buffer that protects against load cases that were completely ignored in the original model.

Using a safety factor1 is like packing extra food for a hiking trip in case you get hungrier than expected. It’s a smart buffer for the known variable: hunger. But that extra food will not help you if you are caught in a blizzard you never planned for. In OTR wheel design, the safety factor1 is the extra food. It adds a margin to the calculated stresses. If the calculation says the stress is "X," the designer makes sure the wheel can handle "2X" or "3X." The problem is, this only works if the original calculation ("X") was modeling the right kind of stress. If the calculation only modeled vertical loads, the safety factor1 is just a buffer for vertical loads. It provides zero protection against the massive side-loads from turning, which is like the unexpected blizzard. A safety factor1 can make a design more robust, but it cannot compensate for a fundamentally flawed or incomplete understanding of how the product will actually be used.
Conclusion
Engineering calculations are a critical starting point, not the final word. True OTR wheel reliability comes from challenging the assumptions behind the math and designing for the real, chaotic world, not the perfect lab.
Explore the concept of safety factors to understand their role in ensuring the reliability of engineering designs. ↩
Identifying causes of field failures can help improve wheel design and prevent future issues. ↩
Understanding OTR wheel calculations is crucial for ensuring the reliability and safety of wheels in real-world applications. ↩
Explore how dynamic forces impact wheel performance to better understand the limitations of traditional calculations. ↩
Learn about FEA to grasp its role in modeling and predicting the behavior of complex structures like OTR wheels. ↩
Explore the significance of load ratings to understand their implications for wheel safety and performance. ↩
Discover the concept of quasi-static loads to understand their limitations in real-world applications. ↩
Explore combined load cases to see how they affect the structural integrity of wheels under real-world conditions. ↩
Understanding stress peaks is crucial for improving wheel design and preventing premature failures. ↩
Learn about fatigue analysis to understand how it predicts the lifespan of wheels under various stress conditions. ↩
Learn about stress cycles to better understand how they influence the durability and performance of OTR wheels. ↩
Understanding the effects of random impacts can help in designing more resilient wheels for unpredictable environments. ↩